
Prove your savings, don't just estimate them
Set your baseline and reporting periods, account for routine and non-routine adjustments, and let ecolyptus model your energy use to calculate exact kWh and cost savings — all aligned to the International Performance Measurement and Verification Protocol (IPMVP).
Book a Demo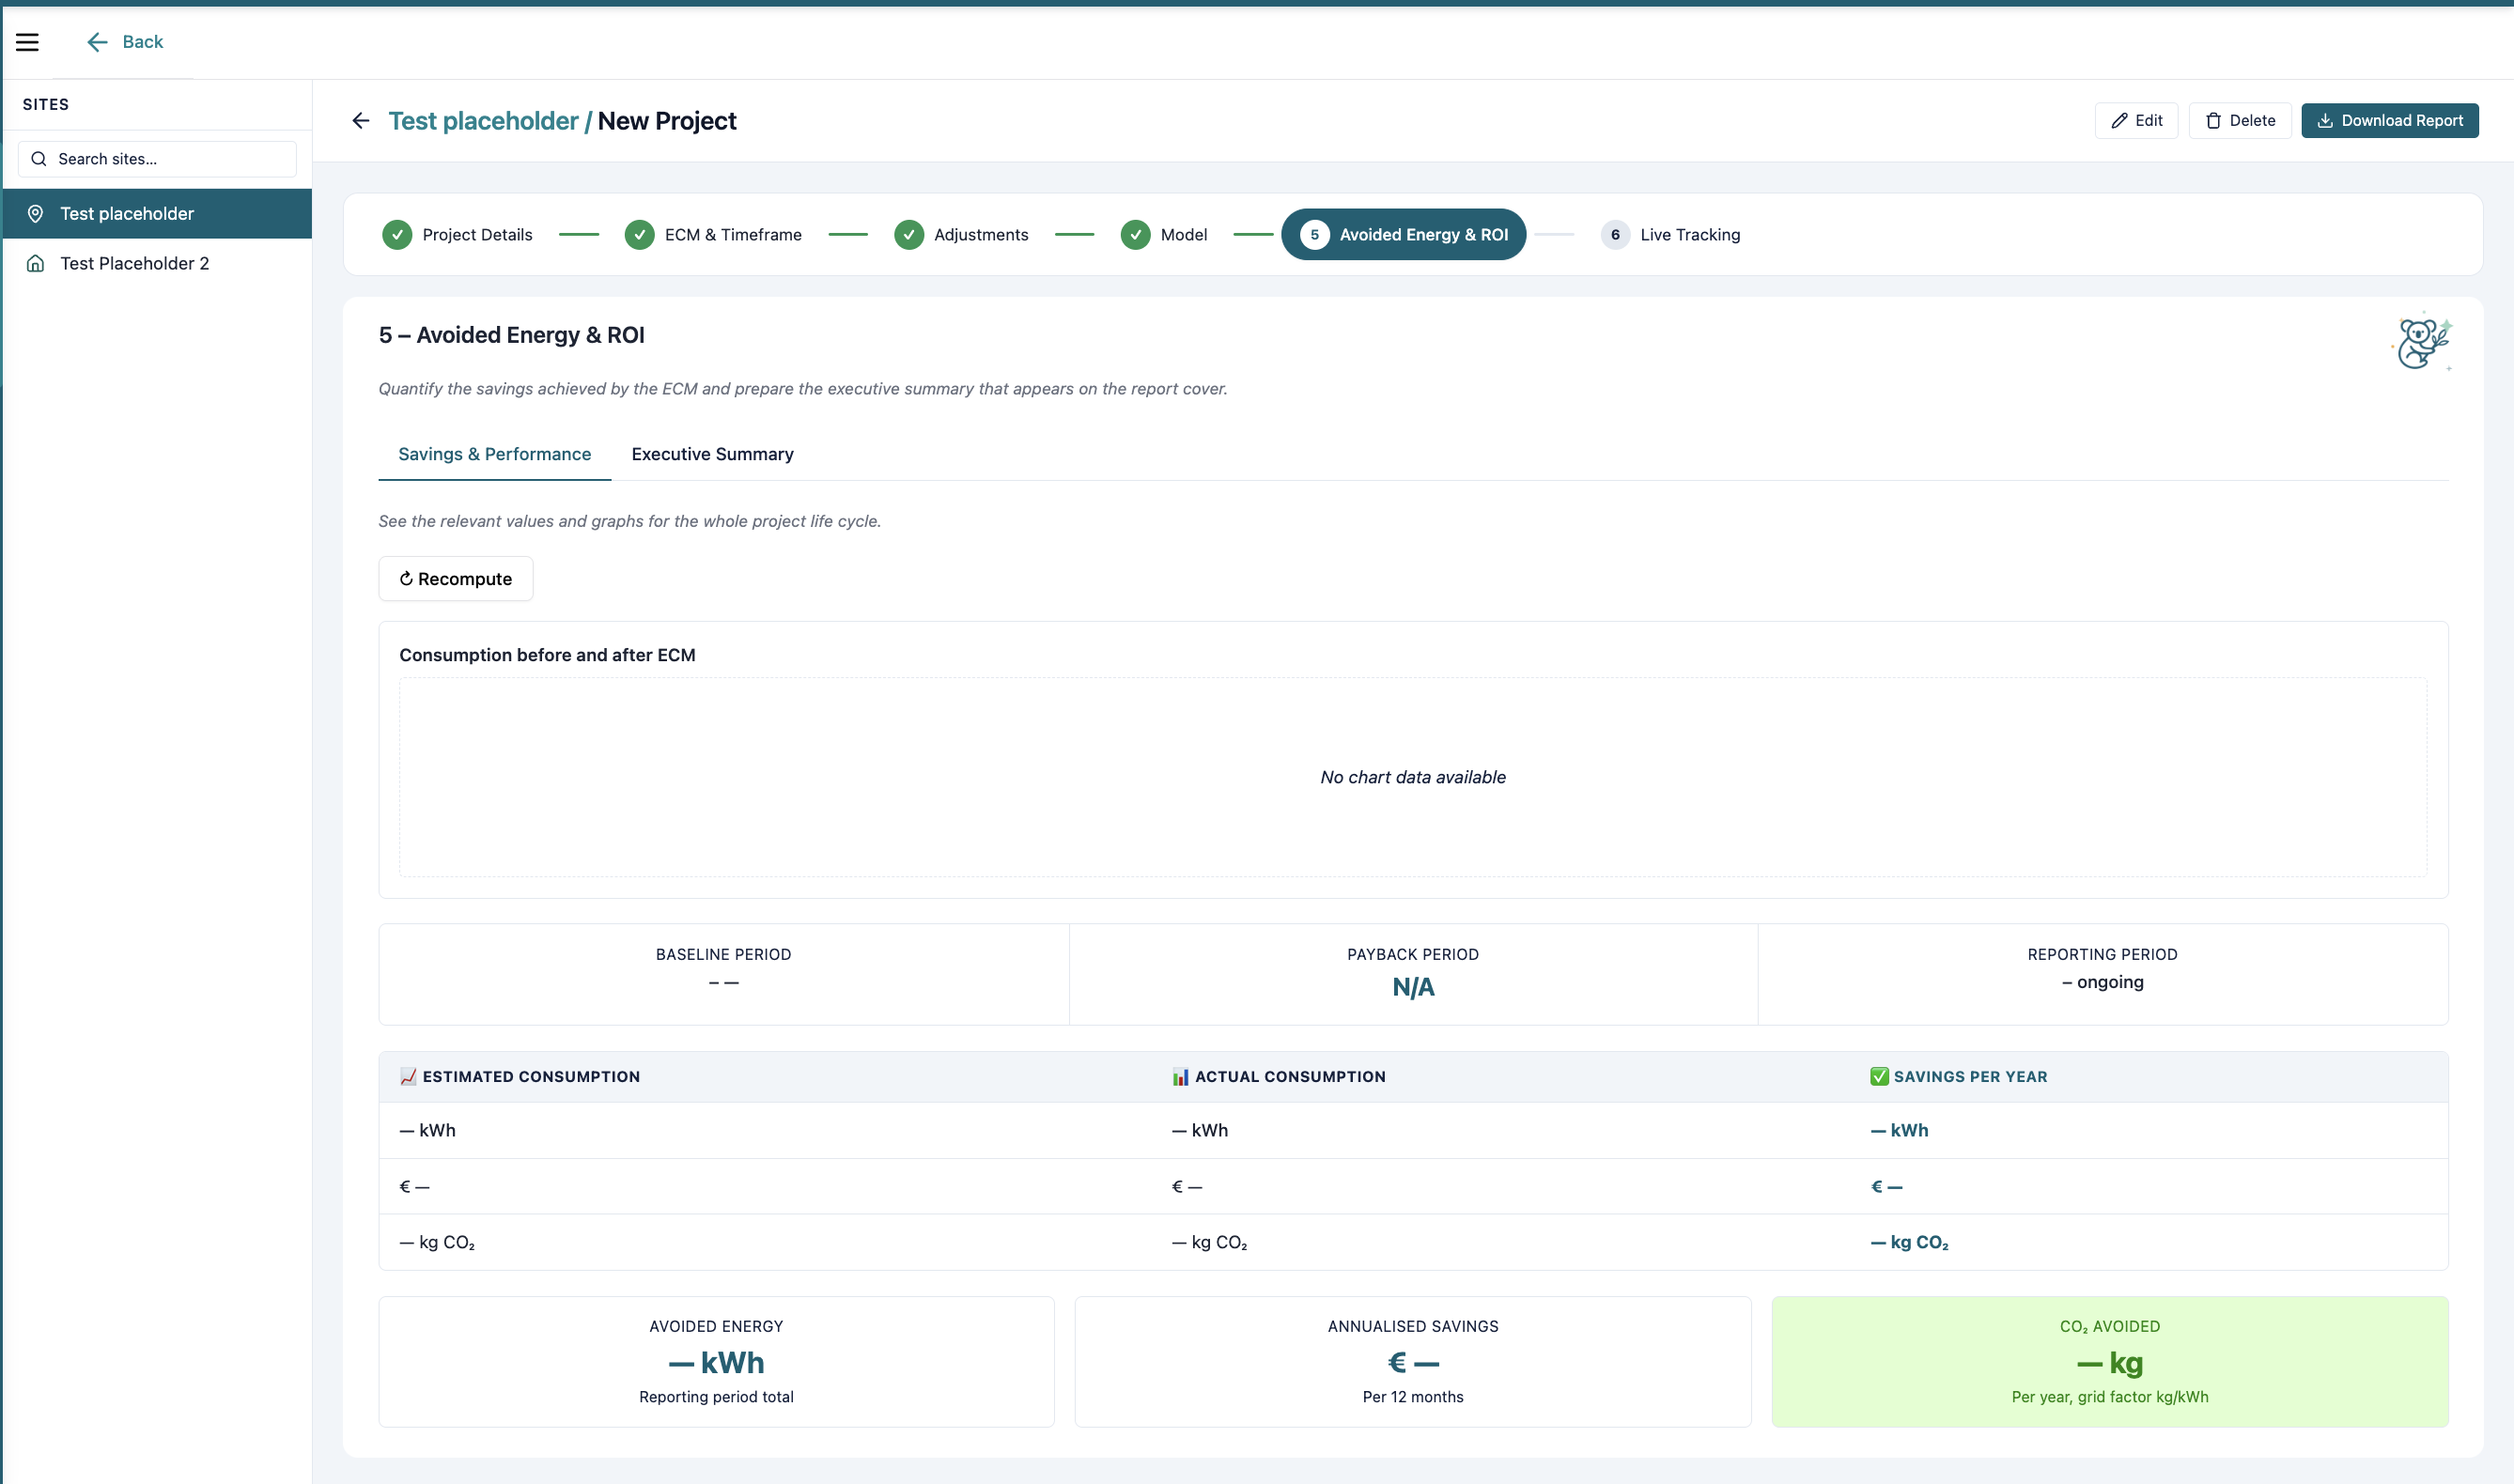
A guided, six-step workflow
Every M&V project follows a clear, structured path from setup to ongoing tracking — no spreadsheets, no rebuilding your model from scratch each reporting cycle.
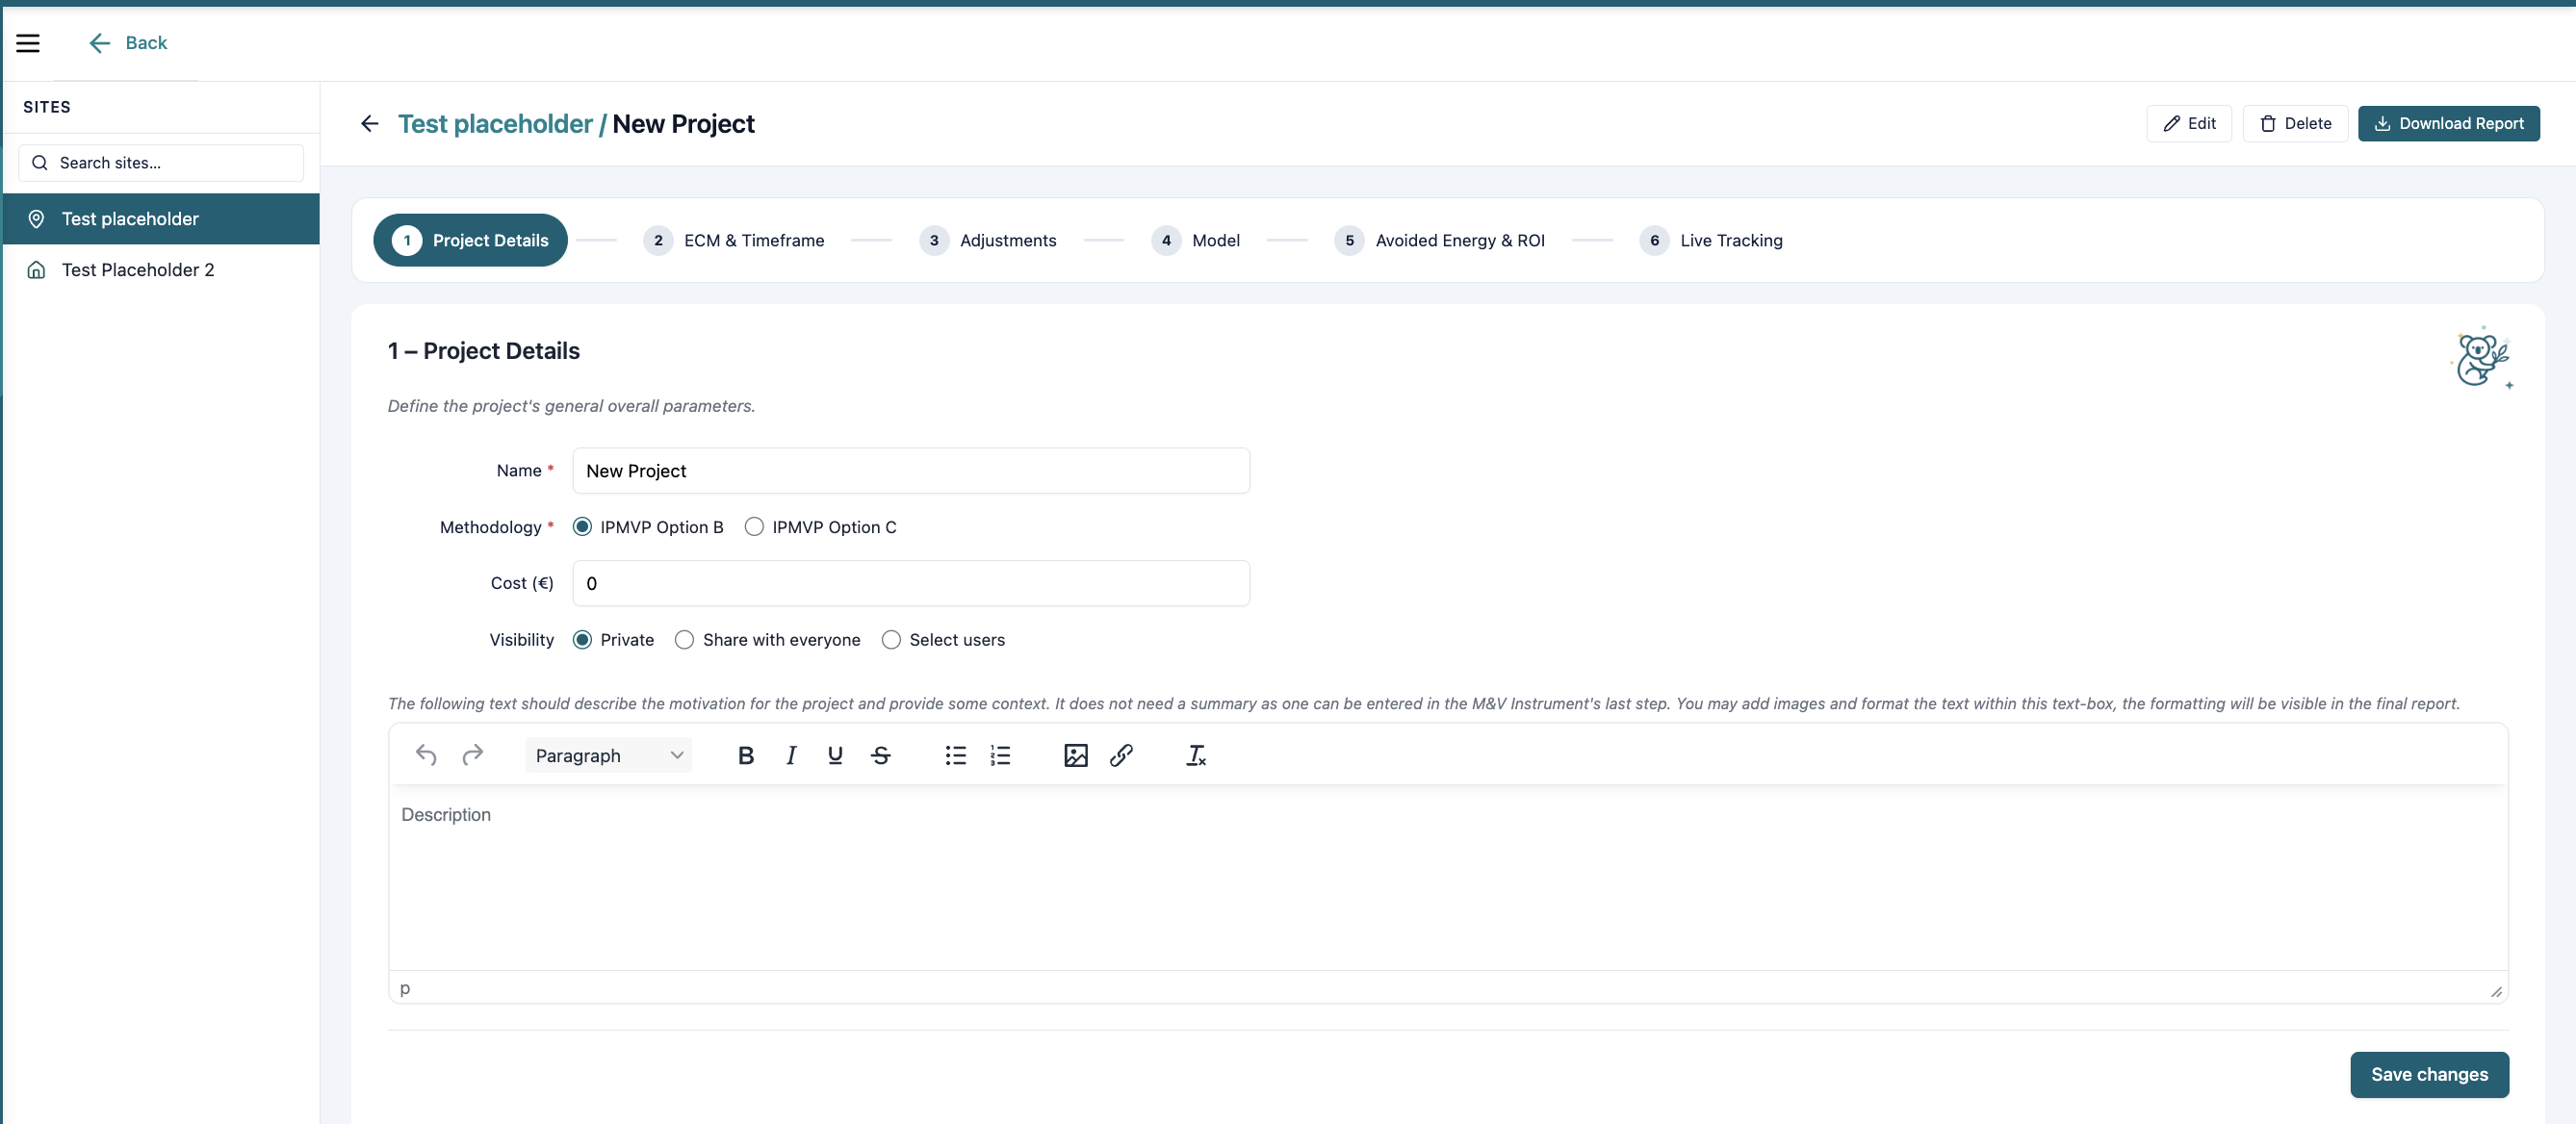
- 1Project Details — Name the project, choose IPMVP Option B or Option C, log project cost, and set visibility (private, shared with everyone, or specific users).
- 2ECM & Timeframe — Define the Energy Conservation Measure installed and the baseline vs. reporting period timeframes.
- 3Adjustments — Add routine and non-routine independent variables to normalize your comparison.
- 4Model — Build the baseline model your actual performance will be measured against.
- 5Avoided Energy & ROI — See your calculated savings and payback period.
- 6Live Tracking — Keep the project current with automated performance updates as new data arrives.
Choose the right methodology for your project
Both are fully supported, aligned to IPMVP, and selected in the first step of every project.
IPMVP Option B
Measures the impact of a single, specific measure — like a lighting retrofit in one area — comparing before-and-after energy use for that isolated change.
IPMVP Option C
Evaluates a whole facility after multiple improvements, comparing overall building-level energy use before and after — the right choice when several measures were installed together, or when isolating one system in detail isn't practical.
Adjustments built on real data, not guesswork
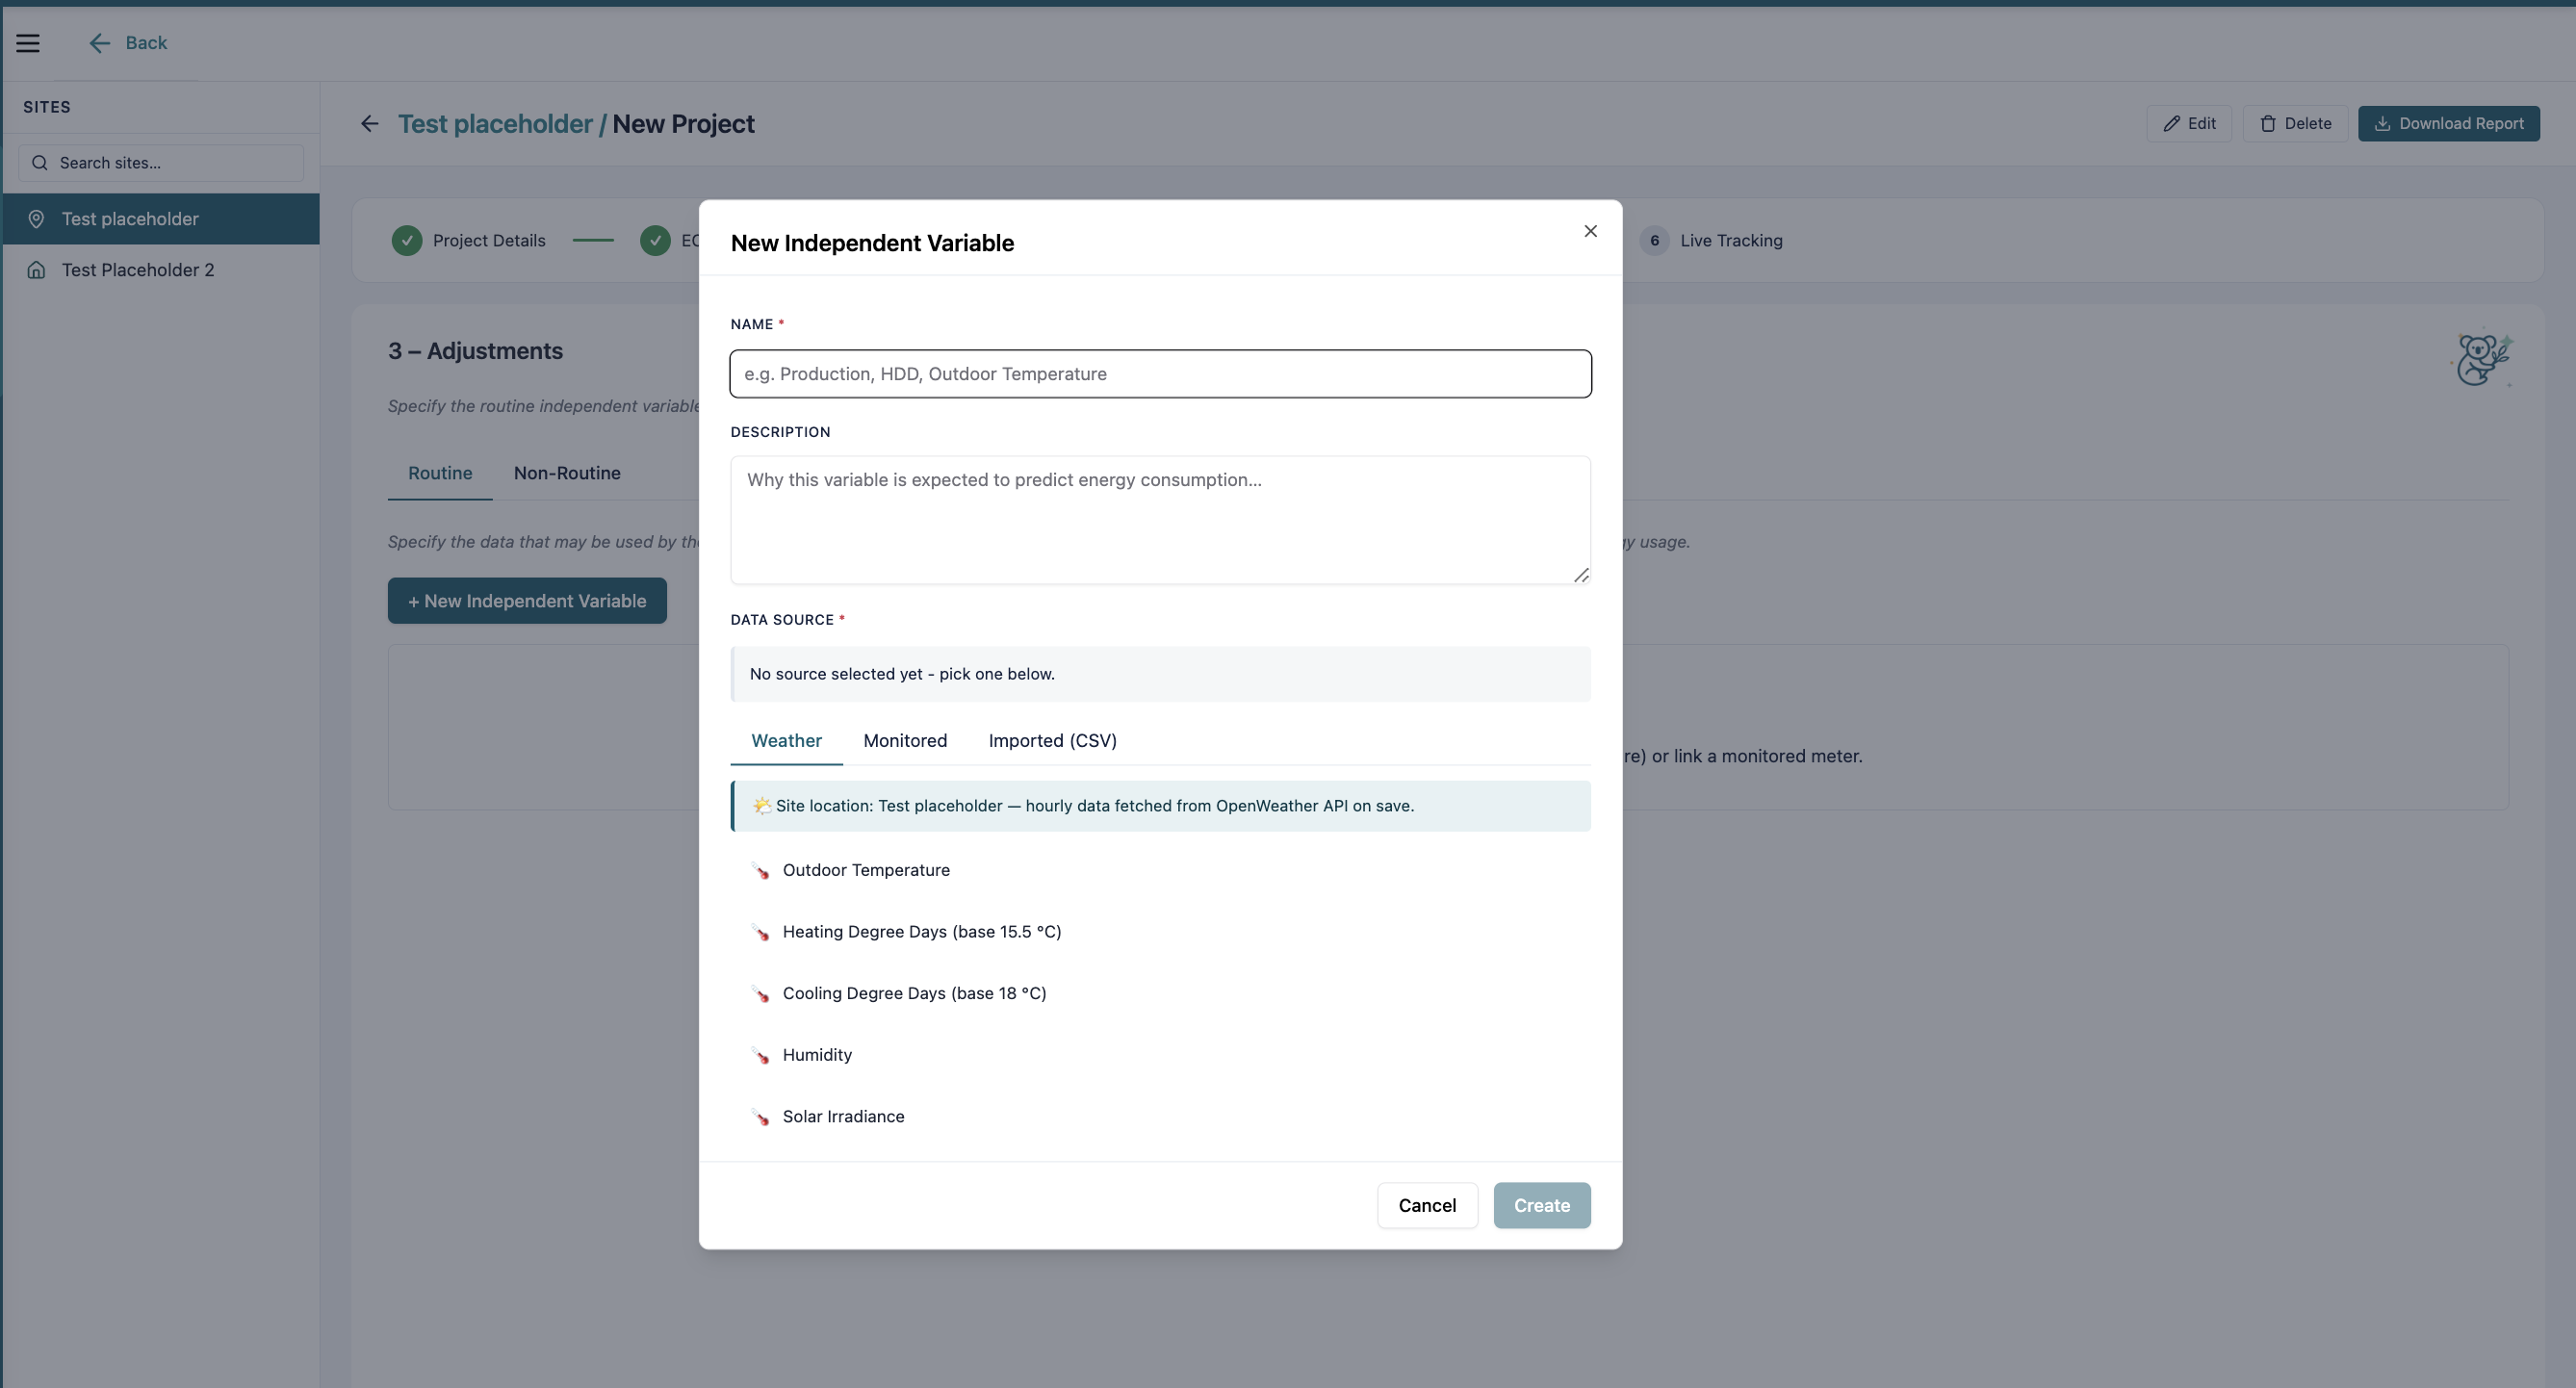
Routine adjustments account for the variables that naturally affect consumption regardless of your upgrade. Add an independent variable and choose your data source directly:
- Weather — outdoor temperature, Heating Degree Days, Cooling Degree Days, humidity, or solar irradiance, fetched automatically for your site's location
- Monitored — link directly to an existing meter
- Imported (CSV) — bring in your own data, like production volumes
Non-routine adjustments capture the one-off events — a shutdown, an unusual production run — that would otherwise distort your comparison if left unaccounted for.
Live tracking: your project doesn't go stale
Once a project is live, ecolyptus can send automated performance updates on a daily, weekly, or monthly schedule, straight to the inboxes that need them. Each notification can include:
- Verified savings to date — energy, cost, and CO₂ avoided since the ECM was implemented
- Performance vs. predicted — actual reporting-period energy against your baseline-adjusted prediction
- Anomaly detection — days where consumption deviates beyond ±2σ from expected
- Model drift indicator — R² and CV(RMSE) trends that flag when your model needs retraining
- Weather correlation insights — whether your chosen independent variables are still predicting consumption reliably
- Raw data summary — daily kWh values for the latest period, attached as CSV
That means an M&V project isn't a one-time report — it's a living check on whether your savings are holding up and whether your model still reflects reality.

Why it matters
Efficiency projects are easy to claim credit for and hard to prove. Without a normalized baseline, you can't tell how much of a change in consumption came from your upgrade versus a mild winter, a slow production month, or pure coincidence. ecolyptus's M&V tool gives you a defensible, IPMVP-aligned answer — the kind that holds up in a credit application, a client report, or a board review.
Audited, not estimated
Turn a savings estimate into an audited, standards-aligned figure.
Catch drift early
Catch model drift before it quietly undermines your reported savings.
Updates without effort
Keep every stakeholder updated automatically, without manually rebuilding a report each cycle.